

The Future of Spotify
The Future of Spotify
Spotify's podcasts data makes interesting reading...

Spotify is an amazing company.
I don’t just say this because I hold the secret ambition that eventually they’ll give me a $500,000 salary and a corner office full of inflatable furniture (and a nameplate reading “NICK’S DREAM EMPORIUM”), but because they hold the keys to unlocking podcasting. For everyone else involved in this game, we are constantly playing with one eye closed, one hand tied behind our back and one leg chopped off with a rusty handsaw. Spotify get the full picture.
They have data from creators and users of its Anchor hosting platform. They have data from all the other creators who distribute via their output mechanic. They have ads data courtesy of Megaphone. They have audience data from their app. They are the one company who has a panoptic view of industrial analytics. And that makes them an amazing company, even if I’m still sitting here on non-inflatable furniture.
Spotify has just released their FAN STUDY, which is a heavily editorialised analytics report released via Anchor for creators. It is a fairly unique set of insights, born of data that we rarely see in podcasting, and therefore I wanted to give it a bit of attention in this newsletter. I’m going to run through some of the key findings here and then, after the paywall (once we’ve ditched the freeloaders) I’ll draw some broader conclusions as to whether there’s anything useful to be extracted.
Spotify divides the report into two sections: REACH and ENGAGEMENT. The former could be broadly defined as “Who is listening?”, “What are they listening to?” and “Where are they listening?”, while the latter is basically just “How are they listening?”. Let’s start with Reach then.
First up, there’s the assertion that “Gen Z's podcast discovery is growing at more than twice the rate of other age groups”. Another way of articulating this might be: Did you realise that Gen Z have barely been listening to podcasts at all?
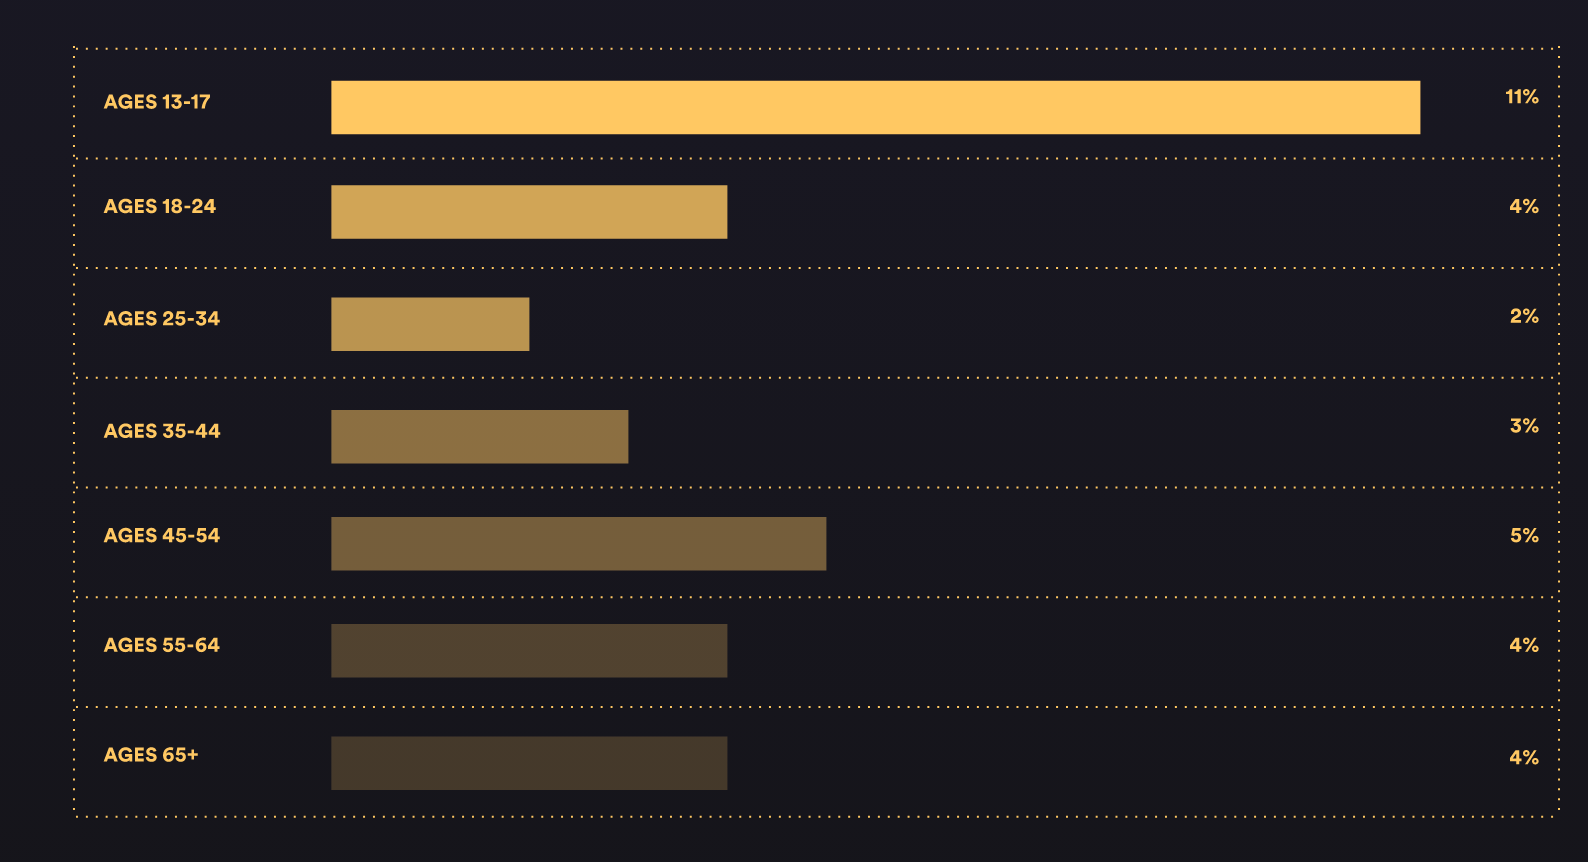
Gen Z is the generation born between 1997 and 2012, making them aged between 10 and 25, so the headline here is a MASSIVE fudge. One slice of Gen Z, Ages 13-17, are growing at 11% while another slice of Gen Z is growing at 4% (which is slower than growth amongst Gen Xers). There is definitely a danger to treating cohorts as homogenous groups who act with a single mind, especially given how little difference there is in the growth amongst older Gen Zers (4%), millennials (2%), Gen Xers (3-5%) and Boomers (4%). In point of fact, the outlying growth spurt amongst younger Gen Zers is probably just down to the fact that kids are getting access to technology, and learning how to use it, younger.
That, and the fact that the market is catering more and more for this younger demographic, which we’ll see in another chart below. If you’re 13 and looking for a good podcast to listen to, and all you have is Joe Rogan railing against the top-band tax rate and Alex Cooper talking about butt plugs, you’re probably not going to catch the habit. If you have a full range of family-friendly and youth-oriented podcasts (including one (1) podcast for every successful TikToker or YouTuber), you’ll catch on faster.
Which brings us then to this, slightly confusingly laid out, chart indicating the over-indexing performance of certain genres in different territories.
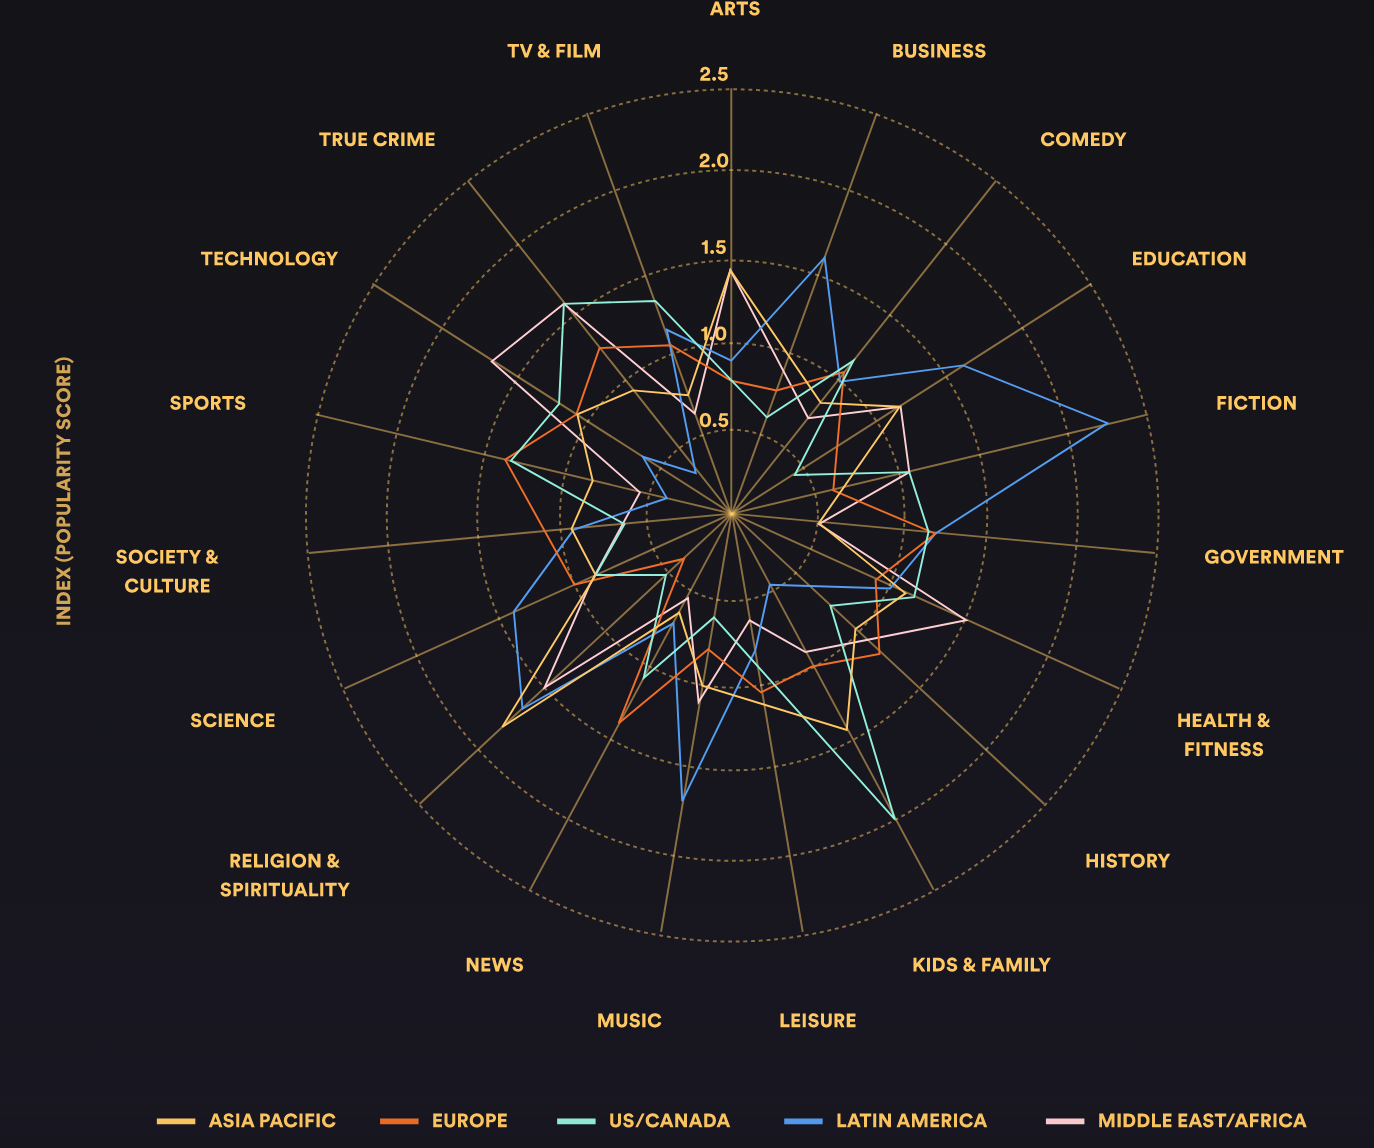
This shows the really interesting way in which podcasting means different things in different countries or continents. Look at the performance of Religion & Spirituality podcasts in Asia Pacific and Latin America compared to Europe. That’s a huge gulf. Similarly, look at Fiction podcasts in Latin America compared to, er, everywhere else. Before I saw this chart, I would genuinely have had no idea that, for most people in Latin America, “podcast” means “fiction podcast”. That’s the default.
The two territories that this newsletter is most concerned with (and the two territories that can, at present, really make you money) are Europe and North America. North America over-indexes in Kids & Family, which is interesting, while Europe is possibly the most even spread of all territories, favouring, slightly, News and Sports.
Maybe the most interesting graph, for me, from this Reach section is this one, which looks at how even very small podcasts have a strangely broad geographic reach.

Satisfyingly, the scale here – for number of listeners – only goes to 100, so we are really dealing with the sort of micro-podcasts that constitute a very high percentage of the total podcast output (but a very low percentage of total podcast analysis). According to this chart, a podcast getting 100 listens will be enjoyed in, on average, 11 countries. Which is kind of remarkable. (I am presuming this data is just for English-language podcasts).
But this is definitely true to my experience of podcasts and the quite random way that they spread through different territories. I have a documentary podcast that I make which, in the past month, has received an inexplicable amount of attention from Australia and New Zealand. It previously went viral in the Netherlands for a fortnight of so. At this point, it has had listeners in basically every country in the world. I suspect that, were the show broadcast in Thai or Arabic or Zulu, this story would be very different.
Now on to Engagement. Here’s what the Spotify report titles the first slide (just so you know it’s not me insulting your attention span, reader who has made it this far): “In a world of short attention spans, you might be surprised at how long podcast fans will listen.”
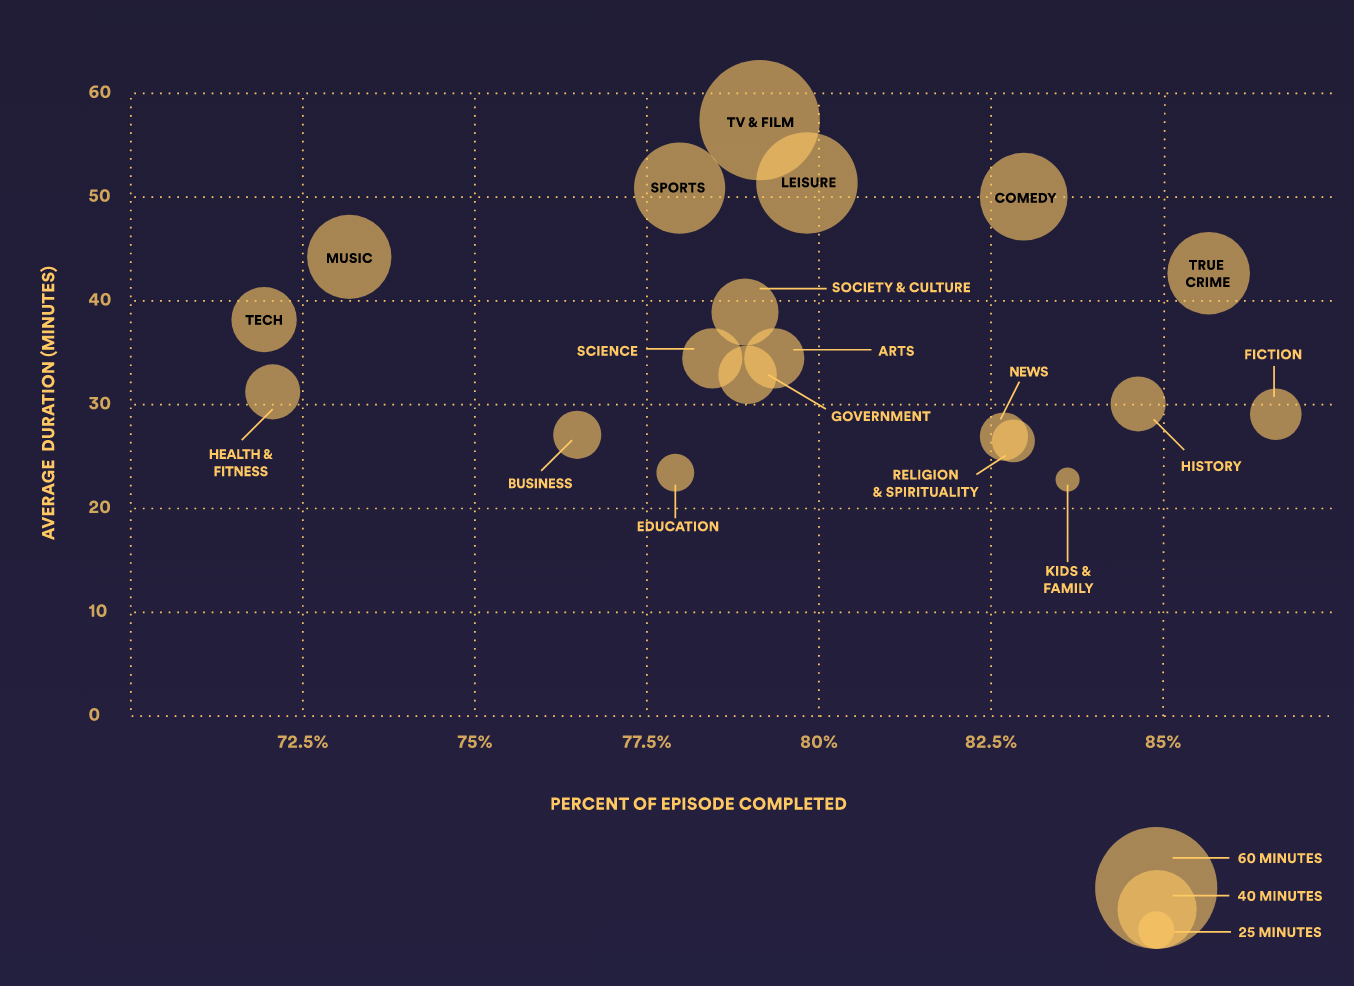
On the Y axis we have the average length of a podcast: TV & Film is, unsurprisingly, the longest, while Kids & Family is, unsurprisingly, the shortest. On the X axis is completion percentage, i.e. how far people get into any particular episode before switching it off. In my experience, anything over 80% is pretty good, and this graph backs that up. Tech and Health & Fitness (which I imagine are genres listened to by roughly the same gaggle of buff weirdos) perform most poorly, scoring an average completion below 70%, while Fiction is, remarkably, top of the charts, ahead of True Crime, with 90%+.
Other than the WILD (to me at least) over-performance of Fiction podcasting (I guess the stumble upon factor is lower here), this graph makes a few interesting observations. Firstly, it suggests no major correlation between episode length and completion rate. What it does expose, however, is a clustering at the average of these averages: in 30-40 minute average duration, there are four genres (Society & Culture, Science, Arts, and Government) who all also score a completion rate between 77.5% and 80%. A similar clustering can be found at the 50-60 minute duration (TV & Film, Sports, and Leisure) which also score 77.5-80%.
These are some of the most established – most radio – of genres. It is not hugely surprising to me that, at the lower end of the completion spectrum you get categories that have far less of an editorial heritage: Health & Fitness, Tech, and Business. But the most lucrative shows ought to ones that are i) long (more room for ads) and ii) finished by listeners. So True Crime remains podcasting’s MVP, but fair play to Fiction – those Latin American listeners are really gassing you up.
Here, below, we have another chart that is pleasingly depressing on audience figures. This time it’s a look at how audience growth on Spotify happens over time.
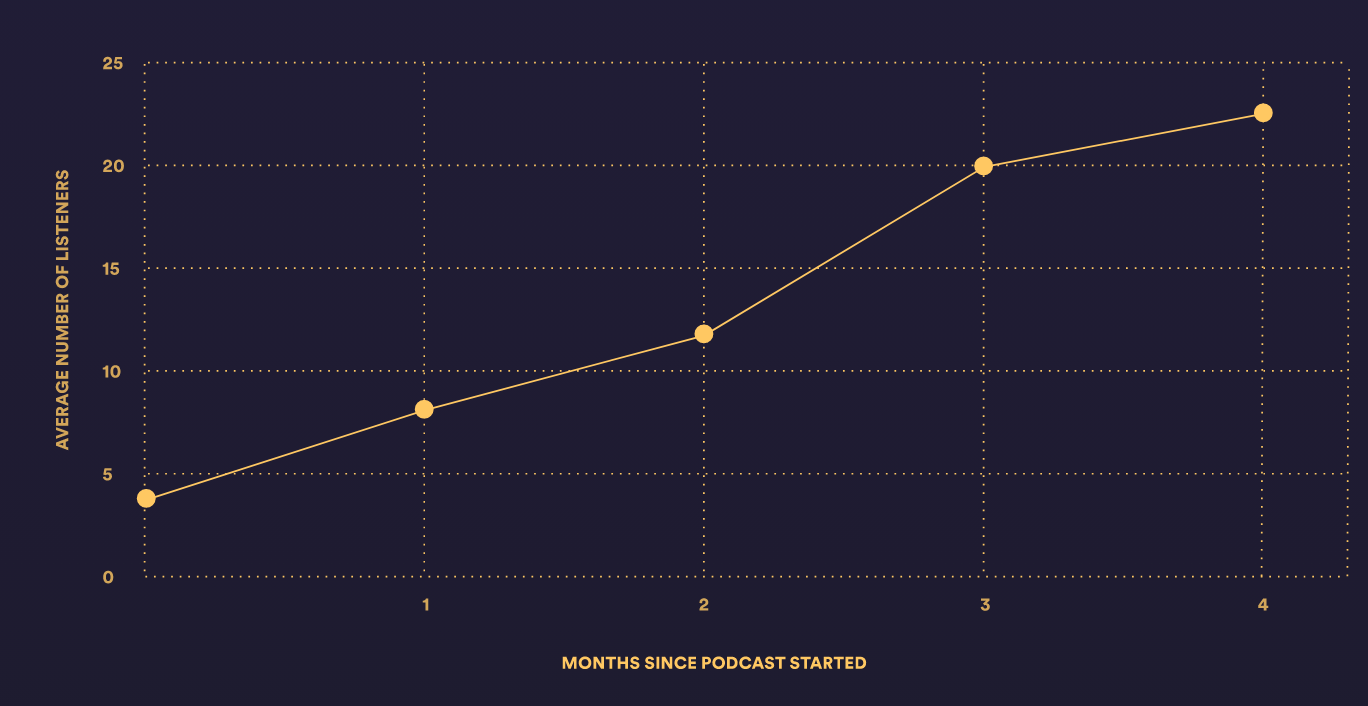
It’s worth saying here that, for most projects I’m involved with, Spotify constitutes about 20-40% of listens, depending on how hard that distribution mechanic is pushed during the show’s promotion. So when we’re talking about having 22 listeners after four months, that could be more like 100+ in reality. But either way, these are quite small beer.
The point that Spotify is making with this graph is not totally clear to me. Here’s what they say, in their own, rather confusing, words: “Rome wasn’t built in a day, and the same can be said for your potential podcasting success. It’s easy to get disheartened when it feels like your podcast isn’t taking off the way you want it to, but there’s often a light at the end of the tunnel! Podcasts on Spotify tend to see their biggest traction within the first four months of your show’s history.”
I’m not sure how you can say “don’t be disheartened if you don’t see immediate growth” and also “biggest traction comes in the first four months”. How much more immediate can you get than “the first four months”? A much more interesting graph would show how stark – and I imagine it’s pretty stark – the plateauing and/or tail-off is as the months go on. That rise, from an average of 4 listeners to an average of 22 listeners over the first four months, is, by Spotify’s own admission, the steepest rise they see. How does it look from Month 4 to, say, Month 12 or Month 24?
All of these charts are fascinating in their own way. They paint a very unique portrait of the ecosystem that Spotify is supporting, and suggest some conclusions that I wouldn’t otherwise have drawn. But are there any wider implications that we might infer?
Keep reading with a 7-day free trial
Subscribe to Future Proof to keep reading this post and get 7 days of free access to the full post archives.